Lies, Damned Lies and Statistics
Lies, Damned Lies and Statistics
Every day, Nicola Sturgeon threatens to have another independence referendum and throw Scotland into more and more chaos. In the HOC we see the SNP continuously attack the UK and the UK political parties. They make statements about Scotland’s economy which are totally untrue and because politicians and the press are almost all unaware or not interested in studying and understanding Scotland’s economic figures, they get away with these false statements.
This is even more important as the SNP’s electoral success is based on these economic falsehoods. Almost every nationalist believes that Scotland’s money is being stolen by England/UK and if only we were independent then we’d be able to keep all this money for ourselves and prosper as an independent Country. The reason why few people know about these economic numbers are because you need to know a lot about our accounts in order to understand them and few people do.
I would like to show you just how false these arguments are using the Scottish Gov’s own accounts, as well as those of the ONS. I will show you Scotland’s real economic figures and this will allow you to counter the SNP with confidence
Before I show you the evidence I will give you a quick financial summary
1: Even before Covid struck Scotland’s economy was in its worse shape, relative to the UK, in over 40 years. Compared to England it’s even worse.
2: Scotland runs deficits which are partially covered by massive fiscal transfers from the UK.
42.7% (£86.3bn) of Scotland’s deficits of £202 billion since 1998 have been covered by UK taxpayers). That money is totally free.
3: Over the last 20 years, Scotland’s debt per person is more than 2.5 times that of England. £13,991 (England) versus £35,949 (Scotland). Source: The ONS
4: Over the last 22 years Scotland has run up more debt than our population share of the UK debt since 1707 (£202 billion)
5: Scotland’s free University education, prescriptions, baby boxes etc etc is paid for not by Scotland’s taxes but by the fiscal transfers from the UK. (In the last 5 years at least)
Now for the evidence
Firstly, let me show you two arguments constantly made by SNP politicians which are patently and demonstrably false.


These two statements by Ian Blackford and Michael Russell are totally false. Unfortunately, all SNP politicians also believe them as well as almost all SNP supporters.
Most SNP politicians have been telling themselves that they’ve been subsidising the UK for years and years (despite not being true) that they’re incapable of taking in the truth that the UK massively subsidises Scotland.
How can I prove these are false?
By showing you data from the Scottish Government’s very own accounts. These are published by the Scottish Government every year and you can find the accounts for 2019/20 here 👇

👆 This is a dataset from the Scottish Government’s accounts going back to 1998, twenty two years in all. They show that Scotland has run up deficits (debt) of £202 billion since 1998. (We have spent more than we earned in every one of these 22 years). However, they don’t show you the fiscal transfers from Scotland to the UK and from the UK to Scotland. These have to be calculated separately.
To calculate a fiscal transfer between Scotland and the UK is very simple. You only need to know the Scottish population and the per capita fiscal deficits/surpluses for the UK and Scotland for any given year.
For the year 2019/20 these deficit figures per capita were
£829 UK Fiscal Deficit Per Person
£2,771 Scotland Fiscal Deficit Per Person
You take £2,771 away from £829 to get the fiscal transfer per person.
£829 - £2,771 = -£1,941.
The £829 is the deficit that we should have run to be paying our own way in the UK. Any Scottish deficit above the UK average means that we receive a fiscal transfers. Any Scottish deficit below the UK average means we give a fiscal transfer. Here’s the UK Gov confirming that sum. They call it a Union Dividend 👇

To get the total fiscal transfer sum you multiply that by the Scottish population for 2019/20.
5,463,300 * £1,941 (rounded) = £10,606m. This is the amount that Scotland received from the UK in 2019/20.
You can repeat this calculation for any single year and the results are in this dataset below. It shows the total fiscal transfers then the transfers from the UK to Scotland then the transfers from Scotland to the UK

The data used before 1998 comes from the Scottish Government’s dataset here. It’s called Historic GERS 👇
You can see that Scotland is in receipt of vast sums of money from the UK these last 40 years. You can also see that Scotland ‘subsidised’ the UK only 14 times out of the last 40 years. This proves that Ian Blackford lied. Also, 10 of these 14 years were between 1980 and 1990.
Since 1990 (30 years) Scotland has only given the UK £1.7 billion but has received some £92.6 billion in return. This also proves that Michael Russell lied as well as Scotland has only ‘subsidised’ the UK four times since 1990, and the sums are tiny. The last ‘subsidy’ from Scotland was in 2010/11.
Scotland has received £66.6 billion in fiscal transfers just since 2007 when the SNP took power with £50.6 billion of that sum occurring in just the last 5 years, our worse financial position since 1980.
The SNP might say that the transfers are worth more in ‘real’ terms (after inflation) and they are correct in that viewpoint. Here is the same dataset using the latest OBR GDP deflator for October 2020. 👇

This dataset shows the figures in what it would be worth in today’s money. It does indeed show a small balance in Scotland’s favour in real terms (£4.3 billion) but only from the year 1980. Go to 1981 and that balance disappears in favour of the UK by about £3 billion. If we calculate to January 2021 from 1980 that £4.3 billion disappears entirely as Scotland will likely have received at least £7 - £10 billion from April 1st 2020 to January 2021.
The ‘real terms’ figures are only really academic anyway as all debt is denominated in cash terms. The main point to take away from these datasets is that Scotland had large fiscal surpluses from 1980 to 1990 and has been dining out on them ever since. Our finances since the economic crash in 2007/08 are the worse in our lifetimes.
Our transfers to the UK since 1990 (real) are only £2.1 billion but we have received in return a whopping £109 billion. About half (c£60 billion) of that £109 billion has occurred in the last 6 years alone.
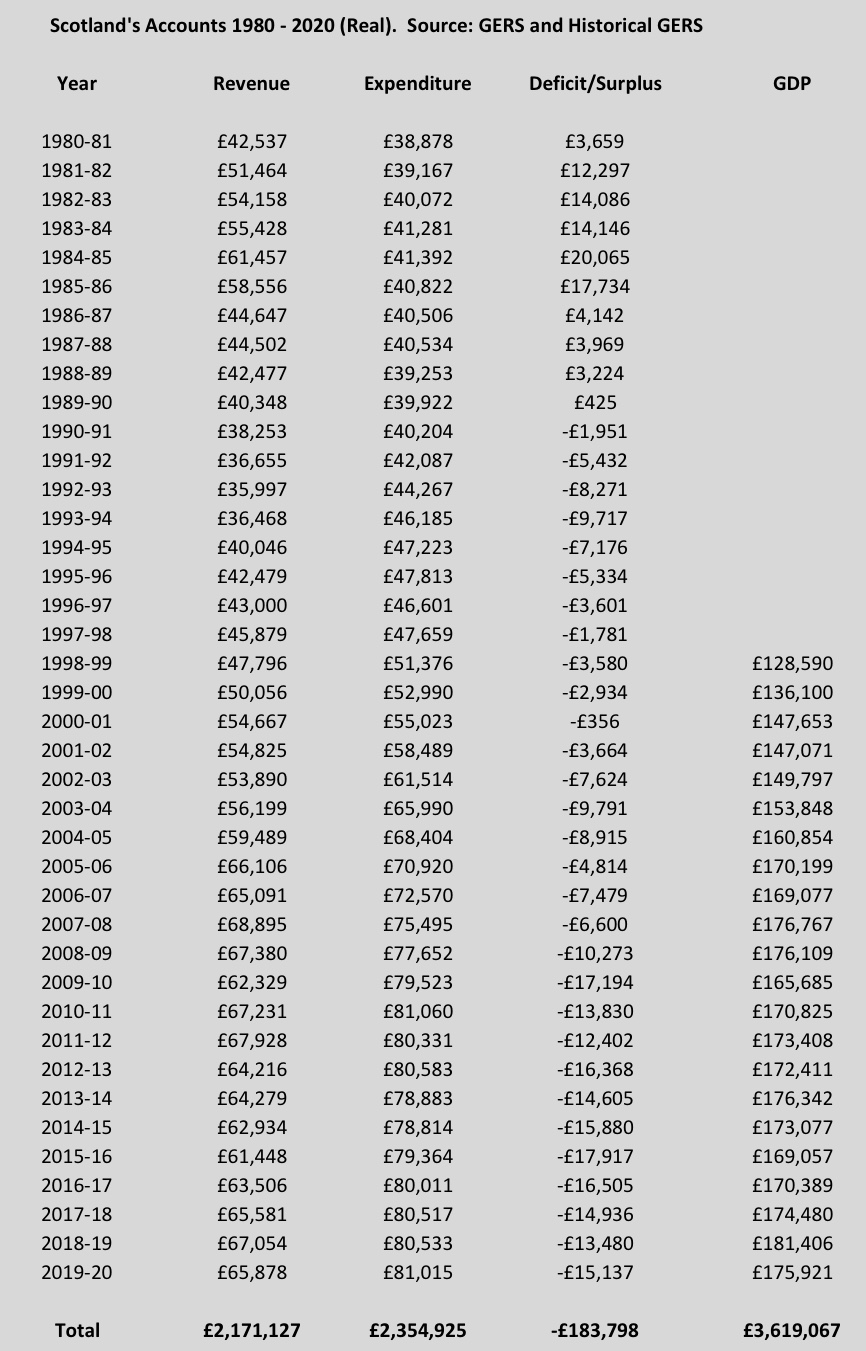
So. What about our accounts going back to 1980? (I have already shown you them from 1998 - 2020) previously. This dataset includes data from 1980 to 1997 and shows how we have fared over the last 40 years from 1980 to 2020. 👇

You can see that we’ve run a deficit every single year since 1990 with surpluses of £34.5 billion from 1980 to 1990 but since 1990 we’ve run deficits of £228.3 billion, giving us a deficit balance of £193.8 billion.
That’s greater than our population share of the UK national debt since 1707. (These numbers also include all our oil revenues. All oil revenues were spent in Scotland according to these accounts).
Accounts in real terms are only ever used for comparison and to calculate real growth rates as accounts are always in cash terms in the year they occur but I have updated them to show you them real terms as well 👇
As you can see, the large fiscal surpluses only make a tiny dent in the debt run up by Scotland since 1980. A saving of only £10 billion in real terms, but only really academic as accounts are in cash terms.
You might have noticed that the fiscal transfers in the 80’s are greater than the fiscal surpluses we ran. This isn’t an error. This is how fiscal transfers work.
——————————————————————-
England.
The UK economy is dominated by England as England makes up almost 85% of the population. So. How does Scotland compare to England rather than the UK?
For that we need to look to the UK Gov ONS data rather than the Scottish Gov data 👇
The only practical way we can compare across the 4 nations of the UK is to look at the deficits/surpluses per person as that strips out the different sizes of populations and levels the playing field. These accounts run from 1999 to 2019, 20 years in total. The 2019/20 data is due out soon and I’ll update this blog when they’re released.
This dataset shows the differences more starkly than the other datasets. England’s deficits per person have been lower than the other 3 home countries in every one of the last 20 years. England also ran fiscal surpluses in the 3 years from 1999 to 2002.
Compared to the rUK, England is an economic powerhouse and if England had been independent in 1999 and ran the same accounts as it has done it would have been one of the most powerful and best run economies in Europe.
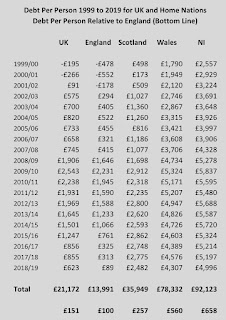
Here’s the per person dataset which shows the deficits and surpluses of the 4 home nations. A negative number is a surplus. 👇

In the last 4 years England’s deficits per person have fallen massively whilst the deficits per person in the rUK are still very high.
If you look at the bottom line you will be able to see the ratio of total debt run up by all 4 home nations plus the UK since 1999. The England debt is set to £100. You can see that for every £100 of debt per person run up by England since 1999, Scotland has run up debt of £257, Wales £560 and NI £658
These massive debts run up by Scotland, Wales and NI would almost certainly bankrupt them but for the fact that England sends them fiscal transfers. This has amounted to some £378.5 billion in the last 20 years. I have used the same calculation method as in the Scottish fiscal grants dataset 👇.

(There are slight differences between the Scottish GERS accounts and the ONS accounts for Scotland due to slightly different calculation methods used by the Scottish Statisticians and the ONS but the final UK accounts are the ONS accounts as they are directly comparable across the 4 UK nations as they use the same methodology for all 4 countries. This is why the fiscal transfer numbers are different between GERS and the ONS, plus this ONS data currently runs one year behind GERS).
The fiscal transfers to Scotland, Wales and NI come from England and not the UK but the explanation as to why this is the case is too long to include in this blog. The simple answer is that England takes on its population percentage share of the national debt, immaterial whether it ran up that debt or not. This then leads to England, and only England paying for the fiscal transfers when the rUK runs deficits (since 1999 anyway).
You can see from the above datasets that the only country in the UK that has done well or is doing reasonably well, fiscally speaking, is England. The other three countries, Scotland, Wales and NI have very underperforming economies plus much higher spending per person than England and rely on large fiscal transfers from England to shore up their economies.
Without these fiscal transfers they would be forced to slash public spending to bring their deficits down and to rebalance their economies.
Debt
Who has run up most debt in the UK these last 20 years?
It turns out that Scotland, Wales and NI have run up the most per person debt in the UK from 1999 to 2019. The total debt run up by the UK was £1,335,051 million and the amounts run up by the 4 individual home nations is detailed in the datasets below 👇


From these you can see that England ran up £742,194m in debt. This is only 55.6% of the total debt despite having almost 85% of the population. Scotland, Wales and NI ran up debts of £592,857, 44.4% of the UK total. The debt they should have run up, had they paid their way, should have been £214,378
£592,857 (debt they ran up) - £214,378 (debt they should have run up) = £378,479 (the fiscal transfers to the rUK) from England.
I do hope that people will be able to use this data to hold the SNP to accounts as few Scottish politicians or journalist seems able to (there are some notable exceptions, Andrew Neil etc etc but not many)
Please feel free to use any data in this blog for your own personal or commercial use.
All of the data can be calculated from the Government Datasets included in the blog.
Edward Thomas Black
Comments
Post a Comment